Reading time: 5 minutes · Published: Jun 2025
Why the Rand is Losing Value
Have you ever felt that your money does not stretch as far as it used to - even when your salary goes up? The reason is not just inflation. It is the steady expansion of the money supply itself.
What Is M3 Money Supply?
M3 is the broadest measure of money in South Africa's economy. It includes:
- Cash in circulation (notes and coins)
- Cheque and savings deposits
- Fixed deposits and money market instruments
- Other liquid assets that function like money
When the South African Reserve Bank (SARB) reports that M3 has grown, it means more rands exist in the economy than before. Those new rands do not disappear - they compete with existing rands for goods, services, and assets.
M3 Growth Over Time
The chart below shows how South Africa's M3 money supply has grown over recent years. Each data point represents the total rands in the economy at that month.
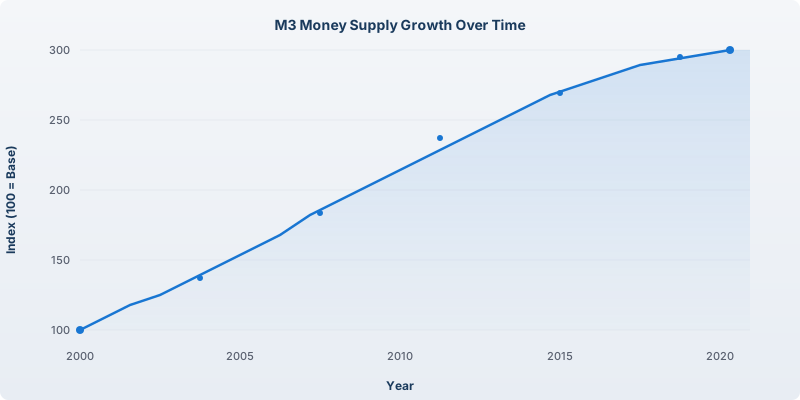
M3 Money Supply growth indexed to 100 at the first data point. The upward slope shows the expanding supply of rands in South Africa's economy.
The Quantity Theory of Money
The relationship between money and prices is captured by the equation:
M × V = P × Y
- M = Money supply (M3) — the total rands in the economy
- V = Velocity of money — how fast rands change hands
- P = Price level — what things cost
- Y = Real output (Real GDP) — the goods and services produced
If velocity is stable, an increase in the money supply must show up as either higher prices or more output. When M3 grows faster than Real GDP, the excess spills into prices — that is inflation.
- M3 Money Supply has grown at an annualised rate of 7.7%
- Real GDP has grown at an annualised rate of 1.3%
- Difference: ~6.4% per year — this is the portion of inflation caused purely by money supply growth exceeding real economic growth
If M3 and Real GDP grew at the same rate, there would be no inflation from money creation. More rands, but also more goods — each rand's purchasing power stays roughly the same. The problem is that M3 consistently grows much faster than the real economy.
Where Does All the Money Come From?
The money supply expands primarily because government borrows from the banking system. When government spends more than it collects in taxes, it issues bonds that are bought by banks — and banks create new rands to buy them.
South Africa's gross government debt tells the story:
- Total gross loan debt: R6.2 trillion
- Debt-to-GDP ratio: 79%
- Up from ~35% in 2010 — the government has been borrowing and spending, and the banking system has been creating the rands to finance it.
Every rand borrowed by government adds to the total money supply. When M3 expands, existing savings lose purchasing power relative to the total. This is why comparing your savings growth against M3 matters more than just looking at CPI.
What This Means for Your Money
When M3 grows, each rand you hold represents a smaller share of the total. Think of it like a pizza: if the pizza gets bigger but your slice stays the same size, your share has shrunk.
This does not mean prices rise instantly or evenly. Some prices rise fast, some slowly, and some assets absorb the pressure. But over time, the trend is clear: when there are more rands, each rand has less purchasing power.
What to Do About It
Understanding M3 growth does not mean panic. It means making informed decisions:
- Compare your salary and savings growth against M3, not just CPI
- Consider assets that may hold their value relative to money supply growth
- Use the purchasing power calculator to see how your money measures up
- Explore the Economic Dashboard for interactive charts of SA's key economic indicators
The first step is awareness. Once you see the trend, you cannot unsee it.